4 posts tagged with "sonification"

View All Tags

Sonifying IR spectroscopy data - finding peaks

Emperor Joseph II: Well, I mean occasionally it seems to have, how shall one say? [he stops in difficulty; turning to Orsini-Rosenberg] How shall one say, Director? Orsini-Rosenberg: Too many notes, Your Majesty? Emperor Joseph II: [to Mozart] Exactly. Very well put. Too many notes. From Amadeus (1984)

It occured to me after a while that my previous attempts at dealing with these sets of data were running into a 'too many notes' problem: 784 resonators at once is always likely to sound like noise! What one would like to be able to do would be to focus in on the visible 'peaks':
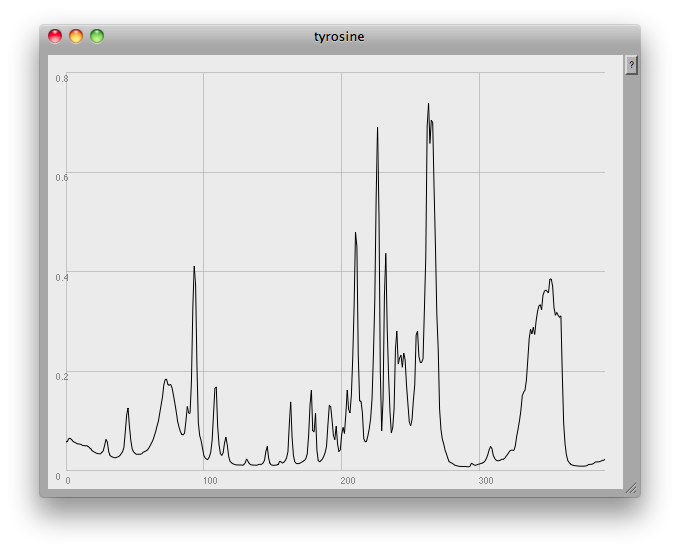
This is something a human can do quite intuitively: in fact, I seem to dimly remember that, many years ago, when I worked with HPLC (High Performance Liquid Chromatography) data at Schweppes, there was a pencil and paper method we used to estimate the height and width of a peak, and thus determine the concentration of a compound by calculating the area under the graph.

A little research into the problem of doing this algorithmically rapidly took me far out of my mathematical depth:

Chao Yang, Zengyou He, Weichuan Yu Comparison of public peak detection algorithms for MALDI mass spectrometry data analysis BMC Bioinformatics. 2009; 10: 4. Published online 2009 January 6. doi: 10.1186/1471-2105-10-4 http://www.ncbi.nlm.nih.gov/pmc/articles/PMC2631518/

Instead, I got some hints on a rather simpler approach from Daniel Mayer by asking a question on the SuperCollider mailing list.

Here's the code I eventually came up with:


(
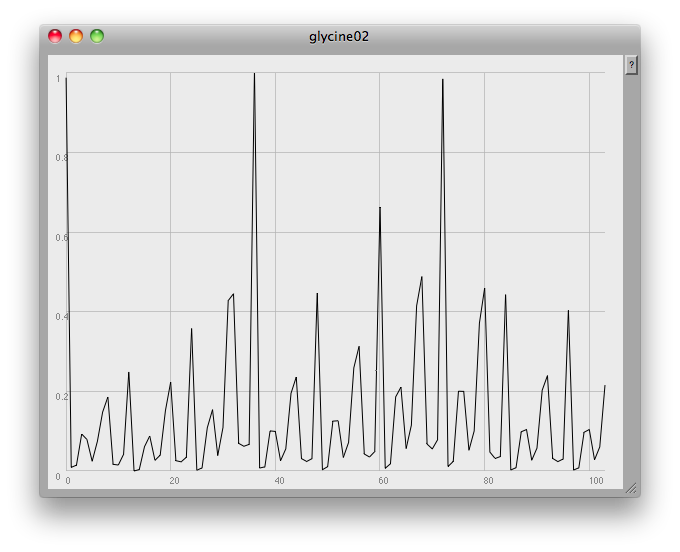
~name = "glycine";
~path = Document.current.dir.asString++"/"++ ~name ++".csv";
f = CSVFileReader.readInterpret(~path);

f = ((f.flop[1] * -1) + 1).normalize;

f = (f*100).asInteger;
f = f.differentiate.removeEvery([0]).integrate;
f = f/100;

~peaksIndices = f.differentiate.sign.findAll([1,-1]);

g = Array.fill(f.size, 0);

~peaksIndices.do { |i| g[i] = f[i] }; // Daniel's line

~amps = g;

// [f,~amps].plot(~name, Rect(840,0,600,450));

~freqs = (36..128).resamp1(f.size).midicps;

SynthDef(\glycine, { | gate=1, amp |
var env, sig;
sig = Klank.ar(`[~freqs, ~amps, nil], PinkNoise.ar(amp/100));
env = EnvGen.kr(Env.perc, gate, doneAction: 2);
Out.ar(0, Pan2.ar(sig, 0, env))
}).add;

Pbind( \instrument, \glycine,
\amp, Pseq(~amps, 4).collect { |amp| if(amp > 0) {amp} {Rest}},
\dur, 0.02,
).play;
)


At the very end of the plot you can see one of the problems: this method finds any and all local peaks, including ones which to the eye look unimportant:
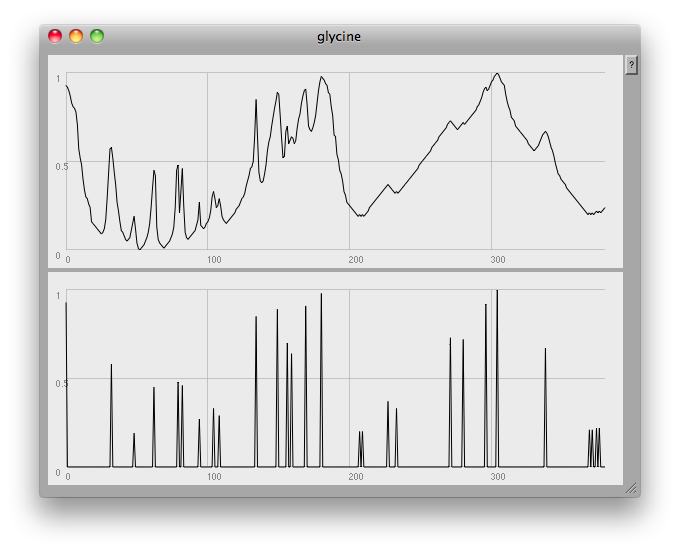
I think what would be needed here would be some low-pass filtering to get rid of small glitches. However, the musical results so far are quite good: once again, here's a short gesture made by crossfading from one compound to another:
Sonifying IR spectroscopy data - automating pitch

Going off in a bit of a different direction here, using the data as automation to drive the pitch of a synth:


( f = CSVFileReader.readInterpret(Document.current.dir.asString++"/water.csv");

f = ((f.flop\[1\] \* -1) + 1).normalize(48,84); //midinotes

Pmono( \default, \midinote, Pseq(f, inf), \dur, 0.005).play )

In this recording, looping up the three chemicals one by one. Kind of cute - early days for this approach.

pmono01.mp3

Sonifying IR spectroscopy data - 'chords'

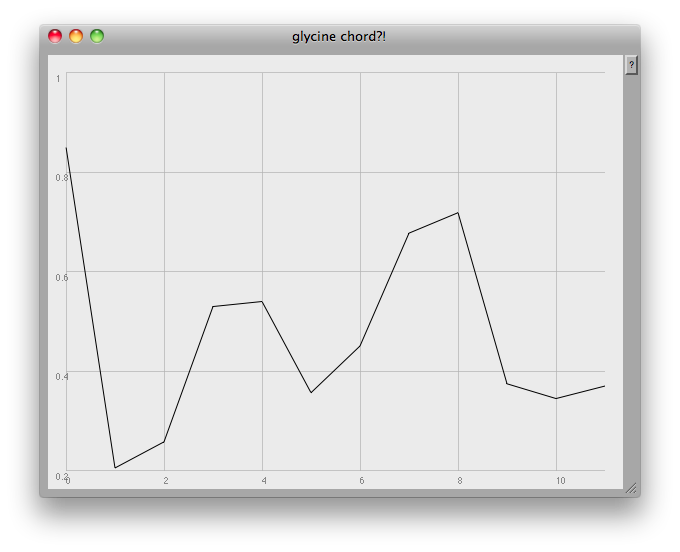
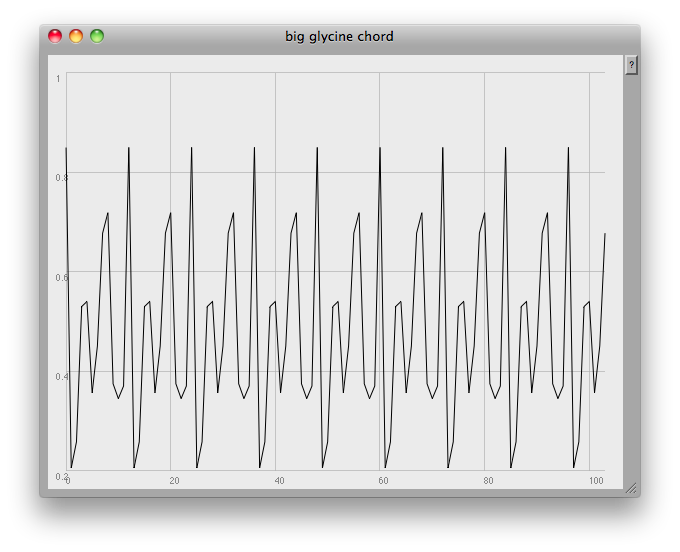
Finding the .resamp1 method in SuperCollider gave me an idea for reducing this rather large set of data into something perhaps more musically useful. Could I make something more like a tonal chord, with pitches repeated in every octave?

I first drastically resampled my data into just twelve points:

f = ((f.flop[1] * -1) + 1).resamp1(12);

These would then be the probabilities of those twelve pitch classes appearing across a range of eight and a half octaves:

f = (f++f++f++f++f++f++f++f++f[..7]); // 104 notes

Then what I did was to multiply this chordal structure by the original data, so that my final sound is the 'glycine chord' amplitude modulated (sort of) by the absorbtion data.

Here's the final code:


( ~name = "glycine"; ~path = Document.current.dir.asString++"/"++ ~name ++".csv"; f = CSVFileReader.readInterpret(~path);
g = f;

f = ((f.flop[1] * -1) + 1).resamp1(12);
f = (f++f++f++f++f++f++f++f++f[..7]);
// 104 notes g = ((g.flop[1] * -1) + 1).resamp1(104);
// 104 samples of orig graph ~amps = f.cubed * g;
// combining two approaches ~amps = ~amps.normalize;
~amps.plot(~name, Rect(840,0,600,450));
~freqs = (25..128).midicps;

{ Splay.ar(Klank.ar(`[~freqs, ~amps, nil], PinkNoise.ar(0.01))) }.play; )

I used this approach to make the sound below, which crossfades from glycine to tyrosine to water, then back to glycine again.

Sonifying IR spectroscopy data

I'm in the very early stages of a collaborative project with Dr Steven Ford, Senior Research Fellow and QC Manager at the Cancer Research UK Formulation Unit of Strathclyde University. Steve came to me with an idea about sonifying IR spectroscopy data, with a view to perhaps drawing some creative parallels between vibrations at the atomic scale and musical sound.

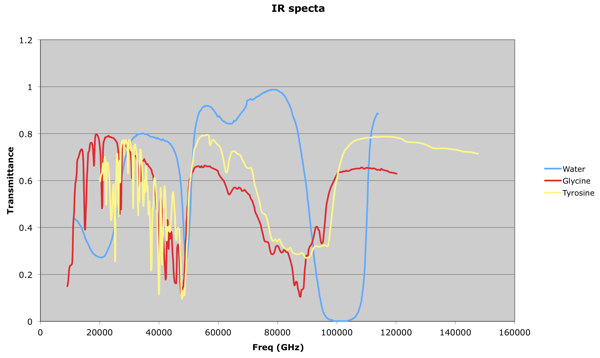
Steve sent me some IR data relating to three compounds, water, glycine and tyrosine, and I've been trying some things out in SuperCollider. Here's a plot of the data which Steve sent me:

Thinking in terms of sound, my immediate thought was to try to scale those resonances into the audio region. Here's one of my first attempts:

( ~name = "water"; ~path = Document.current.dir.asString++"/"++ ~name ++".csv";
f = CSVFileReader.readInterpret(~path);

~amps = f.flop\[1\]; // array of amplitudes ~amps.plot(~name, Rect(840,0,600,450));

~freqs = Array.series(f.size, 40, 100); // size, start, step

{ Klank.ar(`[~freqs, ~amps, nil], PinkNoise.ar(0.01)) }.play; )

water01.mp3

There are 784 points of data here, and I've just mapped those arbitrarily to a bank of 784 resonators, spaced 100 Hz apart, starting at 40Hz. It sounds pretty nasty. Then it occured to me that Steve's data is for transmittance, not absorbance: the points of interest are the troughs, not the peaks, the graph is upside down for what I wanted to do. So:

( ~name = "tyrosine"; ~path = Document.current.dir.asString++"/"++ ~name ++".csv";

f = CSVFileReader.readInterpret(~path);

~amps = ((f.flop\[1\] \* -1) + 1).cubed; // invert, massage ~amps.plot(~name, Rect(840,0,600,450));

~freqs = (64..128).resamp1(f.size).midicps;

{ Klank.ar(`[~freqs, ~amps, nil], PinkNoise.ar(0.01)) }.play; )

Here I was also starting to think about how to bring out the peaks in the data, hence the .cubed. This does make the data 'pointier', but at the expense of the smaller peaks. A slightly different strategy with the frequencies here also, 784 microtonal pitches between midi notes 64 and 128. It still sounds really pretty nasty:

tyrosine01.mp3